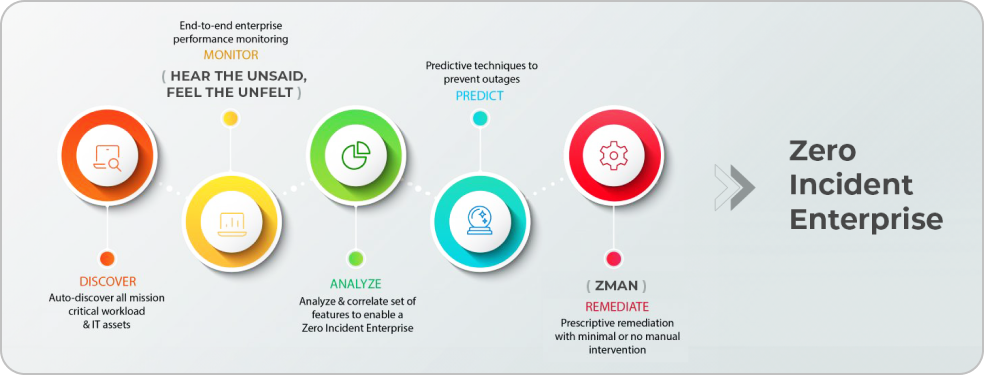
AIOps based TechOps platform that enables proactive detection and remediation of incidents helping organizations drive towards a Zero Incident EnterpriseTM.
The Best AIOPS Platform for Accelerated Business Outcomes with ZIFTM
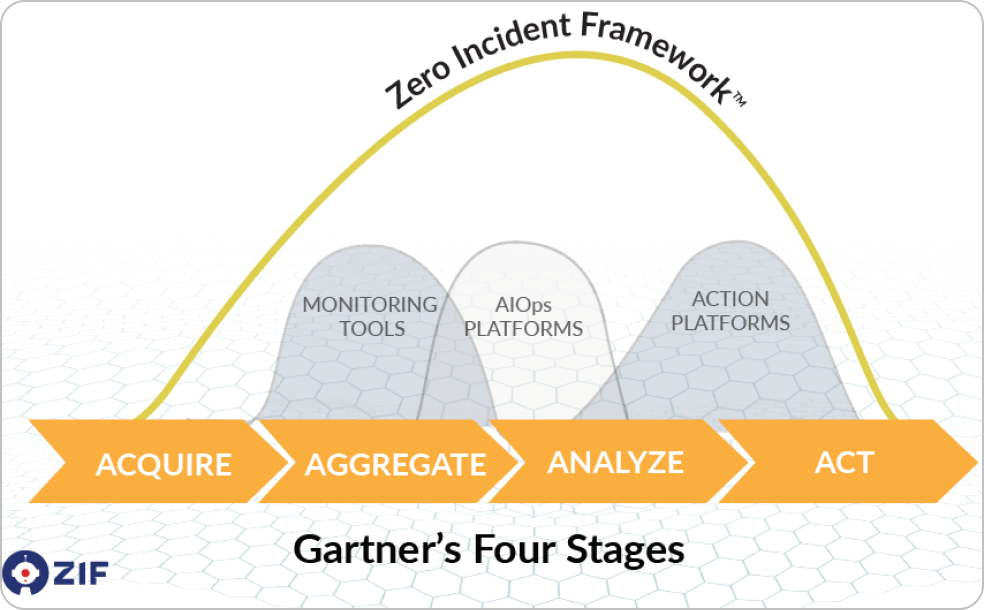
Zero Incident Framework™
Overview
ZIF platform consists of 5 modular components:
How ZIF helps IT Operations?
Get to Know ZIF - Let’s Get Started
Acquire > Aggregate > Analyze > Act
ZIF is an AIOps platform that helps organizations to transform their IT operations from a reactive to a proactive mode. There are various use cases that cater to the needs of IT operations. This guide helps IT operations team and business teams to gain insights on the features offered by ZIF.
ZIF is a big data platform that can stream real time data from various monitoring, ITSM, log management tools. Data ingested into the platform is aggregated and machine learning algorithms are run in real time, helping IT operations team to take data driven actions.
ZIF has bots that can auto heal incidents, based on the predictive analytics driven by machine learning algorithms.
Supervised & Unsupervised algorithms are used in the platform, on streaming data to generate analytics in real time.
Platform Access
Launching Zero Incident Framework™
Zero Incident Framework™ is an enterprise subscription based platform. Users can access the platform via browser or mobile apps.
Enterprises will be provided with a dedicated URL that can be accessed by the platform users. Subscribed enterprise users can register with their corporate email ID and receive an auto generated password to their registered email address or request the administrator of the platform to create an account to access the platform.
Authentication can also be done by connecting to enterprises SAML or LDAP services.
ZIF is a role-based access driven platform. Based on the access defined to the user by the administrator, the menus and features are available for the users.

Dashboard
Canvas Based Design
Dashboard is designed to adapt to a user’s creativity. User can design the dashboard to tell a story about the floor operations or on the pro activeness of the team.
Multiple dashboards can be added by a users and auto rotate can be turned on, to swap the dashboards.
ZIF also offers predefined dashboard templates that are available for the user to select while creating a new dashboard.
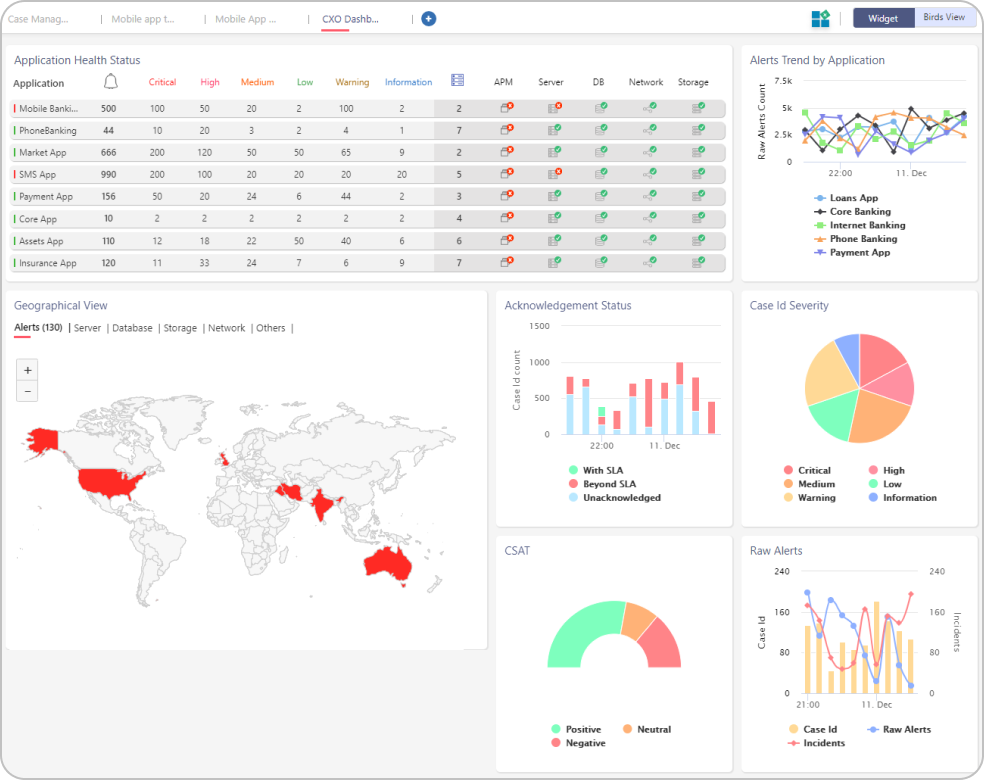
Widgets for Insights
Every insight that is derived from analytics & the data that is ingested into the platform, are displayed as widgets. There are two types of insights in ZIF – Business Insights & Operational Insights.
Business Insights are helpful for managers and above to have a holistic view of the landscape. Operational Insights are helpful for floor engineers to track their day-to-day activities.
Widgets can be positioned on the dashboard’s canvas as preferred by the user. Click and drag option of widget enhances user experience.
Each widget has a settings option; where the user chooses the filter to be applied on the data that is displayed on the widget. These settings are saved to a users profile.
New insights can be developed and deployed as widgets into the production environment of the platform with zero downtime.
Business Process Overview
This view is called the “Birds View” in the dashboard section. Where CXO’s get a full view of their IT landscape which maps business process > business services > applications > devices.
This view help users’ understand how their business processes are getting impacted due to device failures. There are two views on this page – Current View and the Predicted View.
The real time status of the enterprise is displayed in the Current View. The forecast impact of the enterprise is displayed in the Predicted View.
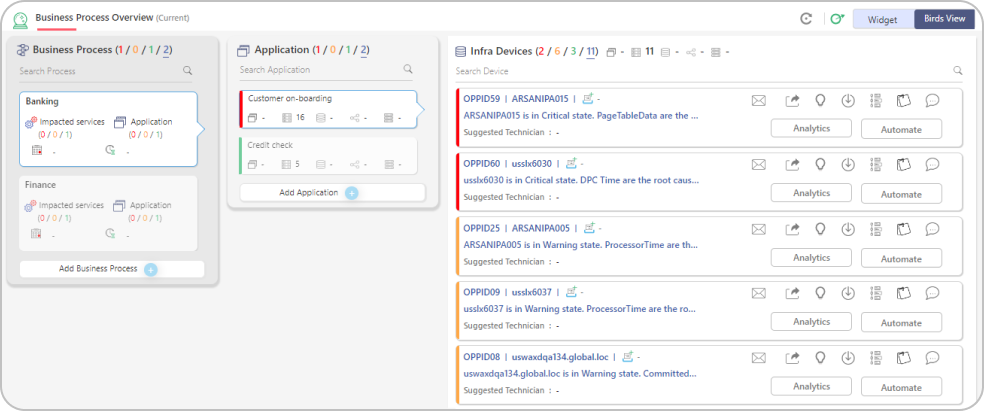
Auto discovery and mapping of the application to devices can be done by Discovery module of ZIF. Business process to application mapping will be done manually by business owners of the enterprise.
Aggregation
Data Aggregation
Key feature of an AIOps platform is to aggregate multiple data types from various data sources. ZIF ingests data into the platform in real time by integrating to various data sources. Refer Integration section to know more about various techniques used.
Unified View – Single Pane
Zero Incident Framework™ provides a single pane view of all data that is aggregated from the IT landscape. This view increases operators productivity, as they get to see the insights across the landscape from one a single pane. As the data is streamed into the platform in real time, this aggregated view gives a snapshot of the current status of the infrastructure.
Alerts & logs generated from multiple monitoring tools, can be aggregated into ZIF and viewed on a single page. Retention period of data within the platform is defined by the organization’s business need.
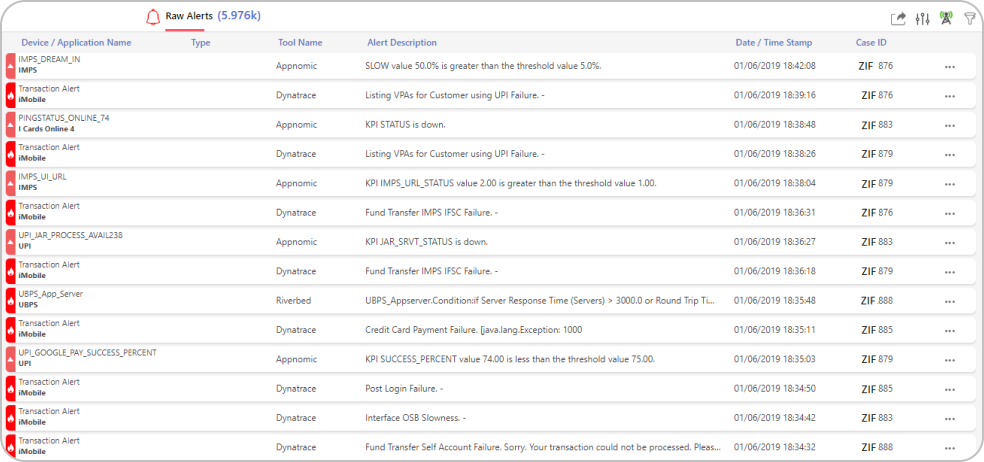
The page is designed with infinite scroll, helping users to navigate to the oldest alert or log that is available in the platform. Device name, application name, alert/log description, severity, timestamp and other additional information as required for the use cases is collected from the external tools.
Data load can be paused by clicking on the live feed icon ![]() and can be resumed by clicking the icon again.
and can be resumed by clicking the icon again.
Filters ![]() can be applied on the data to visualize the required information. User can also set individual preferences
can be applied on the data to visualize the required information. User can also set individual preferences ![]() based on the role or activity they perform. These preferences are saved to a user profile, unless changes are made by the user.
based on the role or activity they perform. These preferences are saved to a user profile, unless changes are made by the user.
Aggregated data can be exported ![]() to a .csv file format for external analysis.
to a .csv file format for external analysis.
Read Architecture section to know more about data streaming in ZIF.
Correlation
Event Correlation
A must-have requirement from an AIOps platform is event/alert correlation. Data aggregated from multiple external tools, are processed using the correlation engine. Correlation happens in real time and unsupervised machine learning algorithms are used in correlation.
Event Correlation Approach in ZIF
Data from various sources are ingested into ZIF in real time either by push or pull mechanism. As the data is ingested, labelling algorithms are run on the data to label the data based on identifiers. The labelled data is passed through the correlation engine where unsupervised algorithms are run to mine the patterns from the labelled data. Sub-sequence mining algorithms help in identifying unique patterns from the data.
Unique patterns identified are clustered using clustering algorithms to form cases. Every case that is generated is marked by unique a case id. As part of the clustering process, seasonality are checked from the historical transactions to derive a higher accuracy on correlation.
Correlation done based on pattern recognition helps in eliminating the need of relational CMDB from enterprise. The accuracy of the correlation increases as pattern reoccur. Algorithms also have the capability to unlearn patterns based on the feedback that can be provided by actions taken on correlation.
Algorithms used being unsupervised, the patterns are learned by the platform with zero human intervention post implementation.
Case Management Features
Correlated events/alerts are clustered as cases in ZIF. Operators analyze each case that is generated and takes appropriate actions as per the operating procedures.
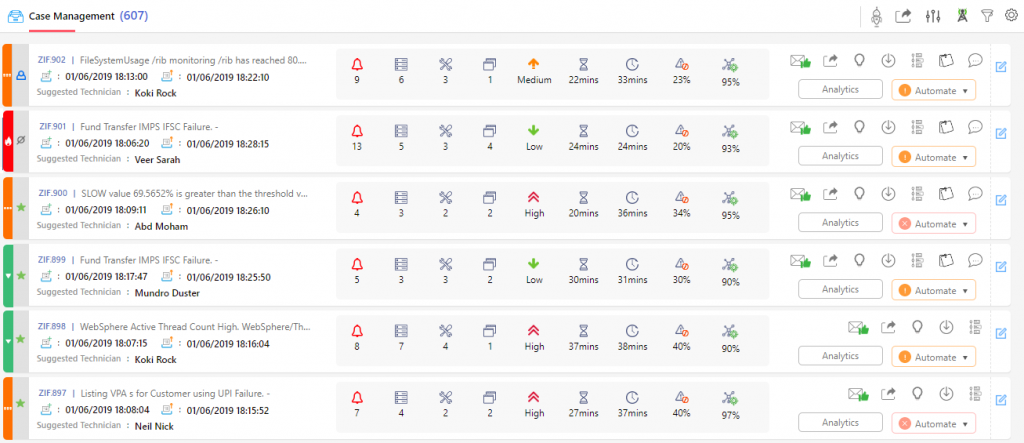
Each correlation that is generated by the algorithm is identified by a unique ID called Case ID. Text “ZIF” is added as a prefix to the id, which helps operators track incidents created by ZIF.
Description of the case that is displayed next to the case id is the probable Root Cause for the identified correlation.
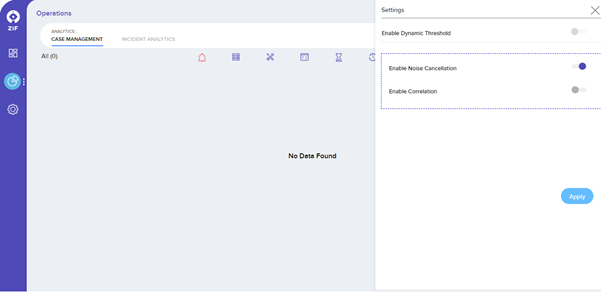
To View Suppression or Correlation use the toggle available in the settings menu on this screen. Toggling between these would enable the operations team to view cases created either from Suppression or Correlation.
To map the severity of alerts that are generated from 3rd party monitoring tools, navigate to Settings menu -> Platform Settings -> Severity Mapping.
After selecting the tool name from the drop-down, the tool severity will be populated and the respective ZIF severity can be mapped by the user.
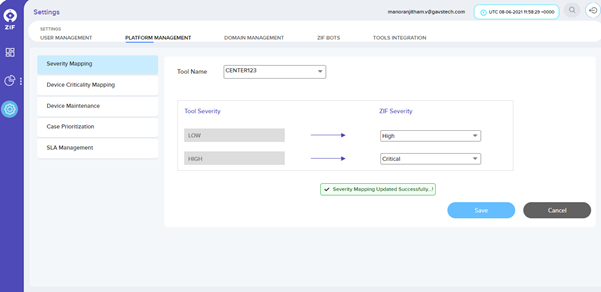
Please Note – List of tools will be populated only if 3rd party tools have been integrated with ZIF using Universal Connector. Please click here to integrate 3rd party tools using the universal connector in ZIF.
Prediction
AIOps should have Predictive Analytics
Predictive analytics has been the unique feature of ZIF. Machine learning algorithms used in the Predictive analytics module of ZIF have been granted a patent in the USA. The module uses unsupervised machine learning algorithms to predict a potential failure or performance degradation in devices or applications.
Once the performance data of applications (transaction time details) or devices (CPU, Memory, Disk, Network) has been ingested into ZIF using the universal connector, the algorithms start to learn the pattern of the data and look for potential anomalies that can cause failures or performance degradations. If issues are predicted by ZIF the same are created as opportunity cards in the platform for operation teams to take action.
The prediction dashboard has 5 swimlanes where the cards are populated. Based on the estimated time to impact the opportunity cards gets generated in wither warning or critical swimlane (if the estimated time to impact is less than 60 mins, the cards are generated in warning swimlane and if they are greater or equate to 60 minutes, then they are generated in critical swimlane)

If engineers have acted on the predictions made by ZIF, then the cards are updated to processed swimlane and if the engineers have missed taking an action, then they become lost cards.
Clicking on each of the cards, the details of the predictions can be viewed by the operations team. These details will identify the root cause of the issue that is prone to happen with the time and date when the issue would happen.

The operations team resolves the issues predicted by ZIF manually by logging into the application or device or can trigger automation bots to resolve the issues.
Discovery
True Agentless Discovery From ZIF
A True Agentelss discovery component from ZIF, enables organizations to discover every single IP device and application available in an enterprise.
IT operations team will get a physical and logical topological view of the entire enterprise. Discovery from ZIF also does Application Dependency Mapping (ADDM). Upstream and downstream connected applications are listed in the topological view.
By enabling a few protocols in the enterprise, ZIF will be able to a seamless discovery.
To Start Discovery using ZIF:
Pre-requisite – All devices to be discovered in ZIF should be enabled with SNMP, SSH & WMI.
- Navigate to RawData -> Settings -> Configuration Settings page to capture the protocol credentials within ZIF. These credentials used when creating a discovery within ZIF.

To start creating discovery from ZIF navigate to RawData -> Settings -> Create discovery. While creating discoveries, users can select a specific location, IP range, and type of devices to be discovered. Users can also enable recursive and non-recursive discovery within ZIF.

After capturing all the details clicking on create discovery will initiate the discovery process within ZIF and the platform will start polling all the devices that are part of the discovery to gather the required information. Once the discovery is complete, the topological view will be displayed for the respective discovery that was run.

Remediate
Choose Intelligent Automation From ZIF
ZIF has an integrated automation module, which can resolve incidents in the IT process by automatically or manually triggering the bots.
Bots developed using any scripting language can be uploaded into ZIF and be re-used in workflows that can be created using ZIF. Workflow creator in ZIF is a low code component, that can be reused by the IT operations team.
Uploading bots to ZIF:
In the settings, option navigate to ZIF Bots tab. Click on upload bot and enter the details of the bot in the sliding window that pop-ups and then click on apply.

Once successfully uploaded the uploaded bot will be displayed in the bot details grid.

The below workflows are available in the platform that is used by the ITOps team. In the upcoming release, more workflows will be added to the platform.
| No. | Use Case | Category | Workflow Description |
| 1 | Windows Service Restart | Servers (Data Center) | Reads cases relevant to Service down alerts from ZIF A&P is used as input and automation workflow parses the target device information from A&P case and connects to the target device to start the service to running state if stopped. |
| 2 | CPU & Memory – Resource Utilization | Servers (Data Center) | Workflow polls the Incident from ITSM Tool at scheduled interval basis the defined filter criteria. It parses the ticket information to identify the device name and connects to the respective device to identify the top 5 CPU & Memory resource consuming processes. Incident is automatically closed when the resource utilization goes below the defined threshold value. |
| 3 | Java Application Restart | Application (Data Center) | Workflow connects to the target server at scheduled interval to restart Java application which are consuming high resource in terms of memory. |
| 4 | Log File Rotation | Servers (Data Center) | This automation workflow connects to the Linux Server to clean up the application & error logs on a periodic basis. It compresses the log files when the defined threshold level is met and deletes old log files from the system after the archival process. |
| 5 | Network printer Automation | End User Computing | Workflow gets the information logged in SR for the Network Printer request and perform action based on Add-Printer/Remove Printer. SR is automatically closed with appropriate journal notes at the end of remediation. |
| 6 | Ping Response Failure | Servers (Data Center) | Incidents are periodically checked in ITSM Tool basis the search parameters (Ex: Category => Monitoring, Subcategory => ZIF Monitor, Short Description => Host not responding) for Ping Failure alerts. Automation workflow connects to the target device logged in Incident and checks the device ping status for reachability. Incident status is updated accordingly in ITSM Tool along with work notes based on device reachability. |
| 7 | IIS Application Pool Monitoring | Application (Data Center) | Workflow automates to start the Application Pool when a pool is found to be stopped or crashed in IIS Server. Also monitors the availability and health status of different Application Pools configured in IIS Server. |
| 8 | Suppress CPU/Memory Alerts Automation | Hyper Automation | Replace the manual efforts involved in monitoring the backup/antivirus scan/database/application critical processes and suppress those high resource usage alerts as part of this automation. Create/Escalate incident to Windows/Linux Server Team through Monitoring Tool alerts in case of consistent high resource utilization basis the process name, hours of running and automatically closes the incident incase of decrease in resource spike. |
| 9 | Windows Process Kill | Servers (Data Center) | This workflow monitors periodically on defined list of servers for critical processes for application availability and automatically kills the topmost CPU & memory resource consuming process. Details of killed process is shared with respective DL via email at the end of remediation. |
| 10 | Make an inactive user in AD to an active user Automation | End User Computing | ITSM Tickets are polled at regular intervals for Employee Rehire Automation. User account is enabled again in Active Directory based on the user information (Ex: Username, Email Address, Employee ID) logged in the request. SR is closed with appropriate work notes after enabling the account in AD. |
| 11 | AD User Account Extension | End User Computing | Tickets are periodically checked in ITSM Tool for User Account Extension Request. Account Expiry date is extended in Active Directory for specific user based on the information (Ex: Username, Email Address, Employee ID) reported in ITSM Tool. SR is closed automatically with appropriate journal notes after updating the user account. |
| 12 | Employee Onboarding | Identity & Access Management | Tickets are periodically checked in ITSM Tool for Employee onboarding requests. Gets the key attributes of user from the SR and creates a user account in Active Directory as part of Employee Onboarding Automation. User is also mapped with respective Security Group based on attributes mapping (Position, Office Location, Country, Business Unit). Ticket is automatically closed with appropriate journal notes and email notification to HR/IT/Admin personnel at the end of remediation. |
| 13 | Automated Execution of Ansible Playbook | Servers (Data Center) | Helps to automate IT infrastructure, Configuration Management, Application Deployment and Software/Package Installation in target machines using Ansible Playbooks. At the end of remediation, automation generates the consolidated result and sends the report to mailing group. (Example: No. of devices succeeded/failed with package installation through this automation) |
| 14 | Apache Process Kill | Application (Data Center) | ZIF Remediation Engine establishes connection with the targeted device to identify the high consuming Apache process in terms of resource utilization and kills the Apache process with top memory consumption |
| 15 | Automated Problem Ticket Creation | Hyper Automation | Creation of Problem Ticket in ITSM Tool when more alerts are generated for a particular device in the last 48 – 72 hours (which is configurable). Ticket includes all the alert identifiers for that device in description/journal notes and assigns it to Resolver Group for their action. |
| 16 | DL Management Automation with ServiceNow | End User Computing | Request gets processed by this Workflow based on SR raised in ITSM Tool for DL Management. User is added as a member of specific DL or removed from DL membership as a part of this remediation. SR gets automatically closed with appropriate work notes. |
| 17 | Hyper-V VM Automation | Servers (Data Center) | Automates the shutdown of VMs at specific slot for maintenance, backups, updates or recover process. It brings back the VM in running mode after the maintenance window slot or Ad-hoc basis through ticket request. |
| 18 | URL Verdict Report | SIEM & Security Management | Observable such as suspicious/phishing URL is parsed from ITSM Incident and scanned for verdict score using Threat Intelligence Tool. Verdict Analysis Report is shared as an email in HTML format with Security Operations Team for blocking the URL in Content Filtering Tool or Firewall based on threat score. |
| 19 | Windows Log Monitoring | Ad-hoc Monitoring | Workflow periodically connects to the respective Windows device and monitors the log file for defined error/key patterns. It raises an email alarm to mailing group when such error pattern is reported in the log file. |
| 20 | Linux Log Monitoring | Ad-hoc Monitoring | Workflow periodically connects to the respective Unix/Linux device and monitors the log file for defined error/key patterns. It raises an email alarm to mailing group when such pattern is reported in the log file. |
| 21 | EDI Monitoring – Reporting of Stuck File | Ad-hoc Monitoring | Monitors the targeted folders in respective server for stuck file reporting based on the file count, age of file, folder/file patterns as part of EDI application monitoring. Reports an incident in ITSM Tool when any stuck file is identified basis the defined monitoring parameters and triggers an email notification to respective mailing group |
| 22 | NFS Space Availability | Ad-hoc monitoring | Monitors the space left on mounted NFS device at regular intervals. It generates an incident in ITSM Tool when the space availability is found higher than the defined threshold level. |
| 23 | Correalated Case/Alert Closure Automation | Hyper Automation | Reads open cases basis the timeframe and closes the cases along with associated alerts in ZIF A&P module. It acts like Tech Bot to identify the open cases (> no. of days) and reports an email alert to DL with closed cases. |
Automation Workflows
Build workflows using ZIF and remediate IT incidents with ease
Dynamic workflow creation component in ZIF is a low code component that helps operations team to develop their own workflows within ZIF. Also, the operations team can reuse the workflows that are available in ZIF, by making a few alterations to the configurations.
Connectivity credential details of the environment (devices & applications) can be stored in the Connections page of workflow. Below are the steps to manage the connection details:
Navigate to the “Admin -> Connections” menu to manage the connections for target servers & external systems
Search for specific connection by using defined “Conn Id” to update the connection & credential information
Click on the “Edit” button to place the record in editing mode
Click on the “Save” button to commit the changes

ZIF workflow also allows the operations team to manage the variables in the script. This can be done from the admin -> variables section. Below are the steps to configure variable:
Navigate to the “Admin -> Variables” menu to manage the configuration entries (Ex: Hostname, Server IP, Log File Path, etc.) required for remediation
Search for the variable by using defined “Key” to update the configuration entries
Click on the “Edit” button to place the record in editing mode
Click on the “Save” button to commit the changes

Reusable Workflows
ZIF WF 1: Windows Service Restart
This workflow establishes a connection with the targeted Windows device and brings up the service that has been stopped.
Before triggering this workflow, make sure the connection details are captured in the connection settings as per the steps above.
Go to the workflow named “WinServiceRestart” and click on “Trigger Workflow” as given below in the screenshot
Place the following text in the input field of Trigger Workflow: WinServiceRestart and click on the “Trigger” button to initiate the workflow.
{“caseId”: “00000”, “caseDescription”:”TESTINGCritical – Service Running Status – Stopped||Service down||Stopped Windows Audio, “, “deviceName”: “10.0.22.176”}

ZIF WF2: Linux Log File Rotation
This workflow connects to the target server (Linux device) to clean up the logs periodically. Logfile rotation will compress the log files when the defined condition is met and remove old log files from the system after the archival process.
Before triggering this workflow, make sure the connection details are captured in the connection settings as per the steps above.
Navigate to the workflow named “Log File Rotation” and click on “Trigger Workflow” as given below in the screenshot
Log in to the respective device to validate the clean-up of log files
Configuration Section for Log File Rotation (Target Device & Source/Target Path) has to be set before triggering the workflow:
Go to the “Admin -> Variables” section to change the target device from the workflow screen
Click on the Edit icon for the record with a key named “LogRotationDevice” and click on “Save” to commit the changes for the updated target device

Repeat the steps to update entries for the key named “LogRotationScript” in Variables Section

ZIF WF3: Problem Ticket Creation
ZIF checks correlated cases and based on the threshold values, a problem ticket will be created in the ITSM tool
Navigate to the workflow named “CreateAlertsProblemTicket” and click on “Trigger Workflow” as given below in the screenshot
Click on the “Trigger” button to initiate the remediation
Log in to the ITSM tool to check the details of the Alerts Problem Ticket

Configuration screen (Connection) to manage the ITSM tool
Navigate to the “Admin -> Connections” section to manage the credentials of ServiceNow
Search for the record with Conn Id named “service_now”
Click on “Save” to commit the changes

Configuration information to manage ITSM tools’ variable
Navigate to the “Admin -> Variables” menu to manage the configuration entries
(Ex: ServiceNowIncidentConfig) required for remediation
Search for the variable by using defined “ServiceNowIncidentConfig” to update the configuration entries
Click on the “Edit” button to place the record in editing mode
Click on the “Save” button to commit the changes


ZIF WF4: Apache Process Kill
ZIF establishes a connection with the targeted Linux device and kill the top memory consuming process in Apache Server
Navigate to the workflow named “Apache_Process_Automation” and click on “Trigger Workflow” as given below in the screenshot
Trigger Workflow: Apache_Process_Automation and click on the “Trigger” button to initiate the remediation
Log in to the respective device and check the currently running processes of Apache Server after remediation

Configuration screen (Connection) to manage the windows device credential
Navigate to the “Admin -> Connections” section to manage the credentials of the Linux Server from the workflow screen
Search for the record with Conn Id named “SSH_Conn_ID”
Click on “Save” to commit the changes for the updated target device if required

Configuration Section for Apache Process Kill:
Navigate to the “Admin -> Variables” section to change the SSH_Host device from the workflow screen
Click on the Edit icon for the record with a key named “SSH_Host” and click on “Save” to commit the changes for the updated target device


Configuration Section for Apache Process Kill:
Navigate to the “Admin -> Variables” section to change the Process_Count_Threshold from the workflow screen
Click on the Edit icon for the record with the key named “Process_Count_Threshold” and click on “Save” to commit the changes for the updated target device


ZIF WF5: DL Management using ServiceNow
ZIF periodically reads the request for DL Management and performs actions accordingly through the Automation workflow
Navigate to the workflow named “DL_Automation” and click on “Trigger Workflow” as given below in the screenshot
Click on the “Trigger” button to initiate the remediation
Log in to the ServiceNow ticketing tool to check the details of the state & work notes updates

Configuration screen (Connection) to manage the zif_api_service
Navigate to the “Admin -> Connections” section to manage the credentials of zif_api_service from the workflow screen
Search for the record with Conn Id named “zif_api_service”
Click on “Save” to commit the changes for the updated target device if required


Configuration Section for DL Management:
Navigate to the “Admin -> Variables” section to change the Service_Task from the workflow screen
Click on the Edit icon for the record with the key named “Service_Task” and click on “Save” to commit the changes for the updated target device


Tools Integration
Integrate Any Monitoring Tool to ZIF
Zero Incident Framework has an inbuilt component called “Universal Connector” that can integrate with any 3rd party tools to ingest data into ZIF. Ingest any format of data using the universal connector in real-time. This component is highly scalable to accommodate any large volume of data.
Universal Connector is a low code component that enables data injection into ZIF without any downtime.
Transformation of data from source to target can also be handled in this component.
The universal connector also has a reusable template that can be reused, to establish a new data
workflow into ZIF.
Let’s get started. Click here to start building new integration.
Introduction To Universal Connector
Universal Connector is a Low Code component for faster 3rd party tools integration
Navigate to App settings Menu and click on the Tools Integration tab menu in ZIF. This will bring up the User Interface, which at this point is a blank canvas for orchestrating a new integration to initiate dataflow:

The UI has multiple tools to create and manage your first dataflow:

The Global Menu contains the following options:

Greenfield integration of New Tool to ZIF
The below steps will guide how to integrate a new tool into ZIF. In the below, sample data ingestion from a local data disk to ZIF has been explained. To reuse integration templates already available in ZIF click here.
Tools Integration
Adding a Processor
Begin creating data flow by adding a Processor to the canvas. To do this, drag the Processor icon (![]() ) from the top-left of the screen into the middle of the canvas (the graph paper-like background) and drop it there. This will give a dialog that allows us to choose which Processor we want to add:
) from the top-left of the screen into the middle of the canvas (the graph paper-like background) and drop it there. This will give a dialog that allows us to choose which Processor we want to add:

There are quite a few options to choose from. To start with, let’s say that we just want to bring in files from our local disk into Universal Connector. When a developer creates a Processor, the developer can assign “tags” to that Processor. These can be thought of as keywords. We can filter by these tags or by Processor name by typing into the Filter box in the top-right corner of the dialog. Type in the keywords that you would think of when wanting to ingest files from a local disk. Typing in the keyword “file”, for instance, will provide us a few different Processors that deal with files. Filtering by the term “local” will narrow down the list pretty quickly, as well. If we select a Processor from the list, we will see a brief description of the Processor near the bottom of the dialog. This should tell us exactly what the Processor does. The description of the GetFile Processor tells us that it pulls data from our local disk into Universal Connector and then removes the local file. We can then double-click the Processor type or select it and choose the Add button. The Processor will be added to the canvas in the location that it was dropped.
Configuring a Processor
Now that we have added the GetFile Processor, we can configure it by right-clicking on the Processor and choosing the Configure menu item. The provided dialog allows us to configure many different options, but we will focus on the Properties tab for this integration. Once the Properties tab has been selected, we are given a list of several different properties that can be configured for the Processor. The available properties depend on the type of Processor and are generally different for each type. Properties that are in bold are required properties. The Processor cannot be started until all required properties have been configured. The most important property to configure for GetFile is the directory from which to pick up files. If we set the directory name to ./data-in, this will cause the Processor to start picking up any data in the data-in subdirectory of the Universal Connector Home directory. We can choose to configure several different Properties for this Processor. If unsure what a particular Property does, we can hover over the Help icon (![]() ) next to the Property Name with the mouse to read a description of the property. Additionally, the tooltip that is displayed when hovering over the Help icon will provide the default value for that property, if one exists, information about whether or not the property supports the Expression Language, and previously configured values for that property. In order for this property to be valid, create a directory named
) next to the Property Name with the mouse to read a description of the property. Additionally, the tooltip that is displayed when hovering over the Help icon will provide the default value for that property, if one exists, information about whether or not the property supports the Expression Language, and previously configured values for that property. In order for this property to be valid, create a directory named data-in in the Universal Connector home directory and then click the Ok button to close the dialog.
Connecting Processors
Each Processor has a set of defined “Relationships” that it can send data to. When a Processor finishes handling a FlowFile, it transfers it to one of these Relationships. This allows a user to configure how to handle FlowFiles based on the result of Processing. For example, many Processors define two Relationships: success and failure. Users are then able to configure data to be routed through the flow one way if the Processor can successfully process the data and route the data through the flow in a completely different manner if the Processor cannot process the data for some reason. Or, depending on the use case, it may simply route both relationships to the same route through the flow.
Now that we have added and configured our GetFile processor and applied the configuration, we can see in the top-left corner of the Processor an Alert icon (![]() ) signaling that the Processor is not in a valid state. Hovering over this icon, we can see that the
) signaling that the Processor is not in a valid state. Hovering over this icon, we can see that the success relationship has not been defined. This simply means that we have not told Universal Connector what to do with the data that the Processor transfers to the success Relationship.
In order to address this, let’s add another Processor that we can connect the GetFile Processor to, by following the same steps above. This time, however, we will simply log the attributes that exist for the FlowFile. To do this, we will add a LogAttributes Processor.
We can now send the output of the GetFile Processor to the LogAttribute Processor. Hover over the GetFile Processor with the mouse and a Connection Icon (![]() ) will appear over the middle of the Processor. We can drag this icon from the GetFile Processor to the LogAttribute Processor. This gives us a dialog to choose which Relationships we want to include for this connection. Because GetFile has only a single Relationship,
) will appear over the middle of the Processor. We can drag this icon from the GetFile Processor to the LogAttribute Processor. This gives us a dialog to choose which Relationships we want to include for this connection. Because GetFile has only a single Relationship, success, it is automatically selected for us.
Clicking on the Settings tab provides a handful of options for configuring how this Connection should behave:

Connection name can be defined if needed. Otherwise, the Connection name will be based on the selected Relationships. We can also set an expiration for the data. By default, it is set to “0 sec” which indicates that the data should not expire. However, we can change the value so that when data in this Connection reaches a certain age, it will automatically be deleted (and a corresponding EXPIRE Provenance event will be created).
The backpressure thresholds allow us to specify how full the queue is allowed to become before the source Processor is no longer scheduled to run. This allows us to handle cases where one Processor is capable of producing data faster than the next Processor is capable of consuming that data. If the backpressure is configured for each Connection along the way, the Processor that is bringing data into the system will eventually experience the backpressure and stop bringing in new data so that our system has the ability to recover.
Finally, we have the Prioritizers on the right-hand side. This allows us to control how the data in this queue is ordered. We can drag Prioritizers from the “Available prioritizers” list to the “Selected prioritizers” list in order to activate the prioritizer. If multiple prioritizers are activated, they will be evaluated such that the Prioritizer listed first will be evaluated first and if two FlowFiles are determined to be equal according to that Prioritizer, the second Prioritizer will be used.
Simply click Add to add the Connection to our graph. We should now see that the Alert icon has changed to a Stopped icon (![]() ). The LogAttribute Processor, however, is now invalid because its
). The LogAttribute Processor, however, is now invalid because its success Relationship has not been connected to anything. Let’s address this by signaling that data that is routed to success by LogAttribute should be “Auto Terminated,” meaning that Universal Connector should consider the FlowFile’s processing complete and “drop” the data. To do this, we configure the LogAttribute Processor. On the Settings tab, in the right-hand side we can check the box next to the success Relationship to Auto Terminate the data. Clicking OK will close the dialog and show that both Processors are now stopped.
Starting and Stopping Processors
At this point, we have two Processors on our graph, but nothing is happening. In order to start the Processors, we can click on each one individually and then right-click and choose the Start menu item. Alternatively, we can select the first Processor, and then hold the Shift key while selecting the other Processor in order to select both. Then, we can right-click and choose the Start menu item. As an alternative to using the context menu, we can select the Processors and then click the Start icon in the Operate palette.
Once started, the icon in the top-left corner of the Processors will change from a stopped icon to a running icon. We can then stop the Processors by using the Stop icon in the Operate palette or the Stop menu item.
Once a Processor has started, we are not able to configure it anymore. Instead, when we right-click on the Processor, we are given the option to view its current configuration. In order to configure a Processor, we must first stop the Processor and wait for any tasks that may be executing to finish. The number of tasks currently executing is shown near the top-right corner of the Processor, but nothing is shown there if there are currently no tasks.
Getting More Info for a Processor
With each Processor having the ability to expose multiple different Properties and Relationships, it can be challenging to remember how all of the different pieces work for each Processor. To address this, you are able to right-click on a Processor and choose the Usage menu item. This will provide you with the Processor’s usage information, such as a description of the Processor, the different Relationships that are available, when the different Relationships are used, Properties that are exposed by the Processor and their documentation, as well as which FlowFile Attributes (if any) are expected on incoming FlowFiles and which Attributes (if any) are added to outgoing FlowFiles.
Other Components
The toolbar that provides users the ability to drag and drop Processors onto the graph includes several other components that can be used to build a data flow. These components include Input and Output Ports, Funnels, Process Groups, and Remote Process Groups, which can be tried for various types of integration.
Reusing Existing Template
This section will explain how to re-use an already existing template in Universal Connector
In this section, we had picked up the AppDynamics connector template that can be reused to ingest data from another monitoring tool, which ingests data using API.
Below is a full visual representation of the AppDynamics workflow that has been configured in Universal Connector:

Right-click on the AppDynamics processor group and click on Enter group.

Go to the Appdynamics_API processor Right-click and select ‘Configure’

Select ‘Properties’ as shown below. Populate the highlighted fields.

- Remote URL (AppDynamics API)
- Basic Auth Username
- Basic Auth Password are required.
Remote URL is the API that fetches data based on event type which consists of Application error, Diagnostic Session, and severities which should consist of Info, Warn and Error.
URL Sample: https://{instance-name} /controller/rest/applications/{applicationId}/events?time-range-type=BEFORE_NOW&duration-in-mins=1&event-types=%20APPLICATION_ERROR,DIAGNOSTIC_SESSION&severities=INFO,WARN,ERROR
This URL can be replaced with another tools URL as well.
Enter the authentication details for the URL.
Start each processor one by one as shown in the image below (Right-click and select Start) till the “TransformJson” processor

If data cleansing needs to be altered, do the same in the “TransformJSON” processor. Right-click the queue which resides before “TransformJson” and select List Queue to view the data inside it.

List Queue will display all the data that is getting ingested from the monitoring tool into ZIF via Universal Connector.